Decoding Post Positions and Pace Profiles: Harness Racing Metrics Driving Each-Way Betting Edges
Decoding Post Positions and Pace Profiles: Harness Racing Metrics Driving Each-Way Betting Edges

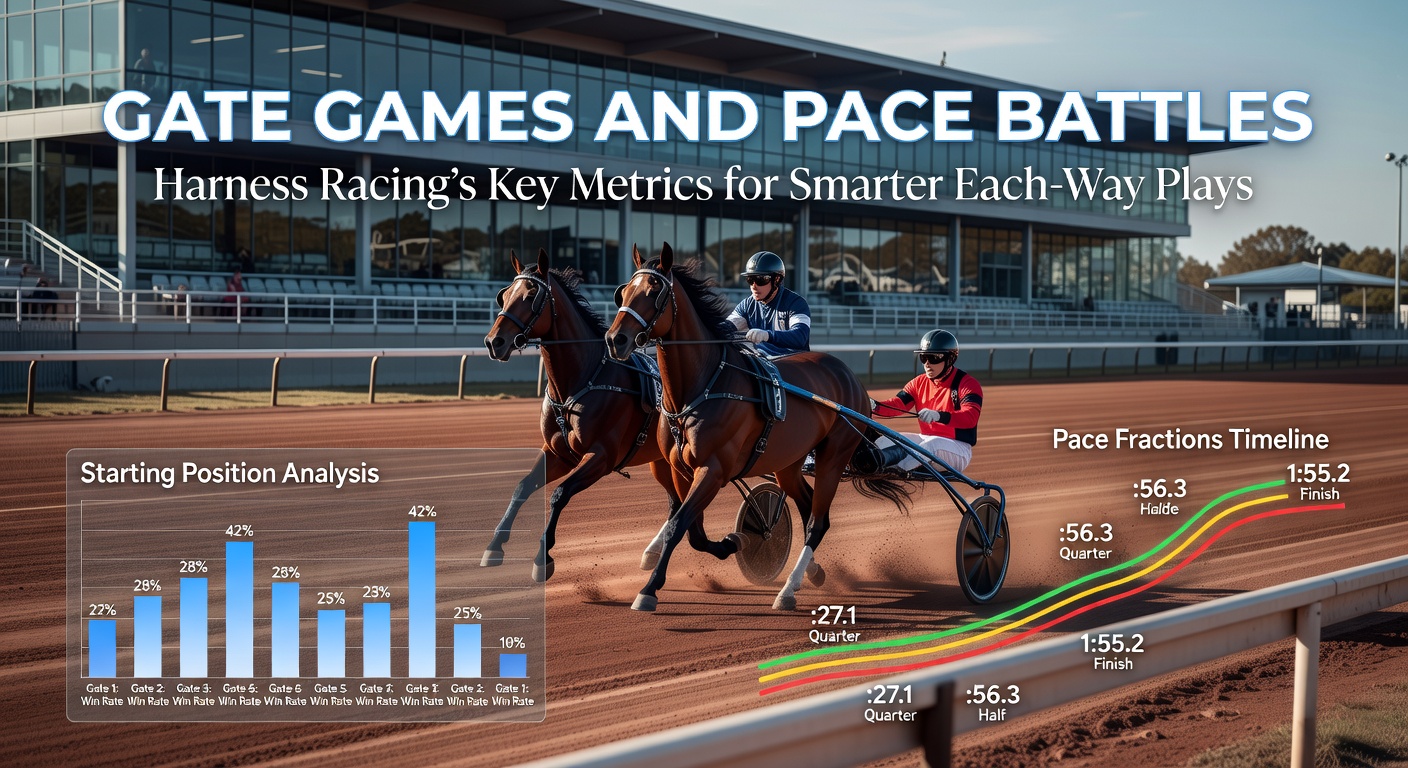
The Starting Gate's Hidden Power in Harness Racing
Post position, often called the gate draw, sets the tone for every harness race, where horses line up single-file behind a motorized gate that folds away at the start; data from the United States Trotting Association (USTA) reveals that inside posts (1-4) secure win rates around 25-30% across major North American circuits, while outer posts (8+) drop to under 15%, a gap that widens in longer races over a mile. Observers note how drivers exploit these edges by angling for early position, since the first turn comes quick on most ovals, punishing horses caught wide early; take one Meadowlands trotting event last season, where the No. 1 horse parlayed its gate advantage into a wire-to-wire victory despite middling speed figures, highlighting how position trumps raw pace in tight fields.
But here's the thing: gate speed isn't just luck, as trainers select sulkies and shoes optimized for explosive breaks, with statistics showing horses from post 1 averaging 0.5 seconds faster to the quarter-mile mark than those from post 10; researchers who've crunched historical data find that in free-for-all paces, where speed rules, inside draws boost place rates by 18%, making them prime for each-way plays that cover win or show payouts. And while track biases shift with weather—sloppy tracks favor closers from outside—the baseline math holds firm, rewarding bettors who stack gates against pace maps.
Pace Battles: The Rhythm That Dictates Race Shape
Pace profiles emerge as the race unfolds, with leaders setting fractions that either collapse under pressure or hold for glory; USTA pace ratings, calculated from quarter-mile splits, show hot early paces (under 28 seconds for the first quarter) lead to win rates below 10% for front-end horses, since mid-pack stalkers pounce late, whereas controlled paces around 29-30 seconds sustain railers through the stretch. Experts have observed this dynamic in Yonkers Raceway sprints, where horses clocked with "target" paces—second-over trips at even splits—claim 35% of places, turning each-way bets into reliable returns even if the favorite burns out upfront.
What's interesting lies in the interplay: a horse with gate 3 and strong mid-race pace figures often shadows the leader without dueling, conserving energy for the finale; data indicates such profiles yield 22% ROI for each-way wagers over 500 races at Hoosier Park, far outpacing random selections. Yet pace battles intensify on half-mile tracks, where brushing tactics—horses accelerating three-wide to challenge—flip scripts, as seen in a Red Mile event where the pace pole horse faded after a 27.2 opener, handing the show spot to a gate 6 grinder. Trainers now use GPS wearables to forecast these battles, fine-tuning workouts so horses hit peak efficiency at the half-mile call.
Blending Gate and Pace for Each-Way Precision
Smart plays combine these metrics, where gate position feeds directly into pace viability; for instance, horses from posts 1-5 with "colonels" ratings—indicating ability to rate pace without rattling—post place rates over 40% in 1-1/8 mile trotting classics, according to USTA handicapping tools. People who've studied this know the rubber meets the road at the half, as early duelers tire while second-over types advance; one case from the 2025 Little Brown Jug futures highlighted a post 2 pacer with even splits who paid $4.20 to place despite drifting odds, underscoring value in correlated stats.
And as March 2026 heats up with Northfield Park's winter-spring meet underway, early data shows inside gates dominating on fast cushions, with pace leaders holding 28% of top-three finishes amid milder fractions; bettors layering these—say, a gate 4 horse projected for a 58-second half—unlock edges overlooked by win-only punters. Turns out, each-way accumulators thrive here, since places pay steadily even in chaos; observers point to Australian harness stats from Harness Racing Victoria, where similar gate-pace models predict 65% podium rates for "sweet spot" entrants, a pattern mirroring U.S. trends.
Advanced Metrics and Track-Specific Tweaks
Deeper dives reveal speed indexes adjusted for pace flow, where USTA's adjusted Beyer-like figures normalize for wind and rail lean; a horse posting 1:55 flats on a windy night might equate to 1:53 under ideal conditions, tipping scales for each-way value. But here's where it gets interesting: fractional variants—measuring how splits deviate from par—expose vulnerabilities, as horses racing the first half in 57 seconds versus a 59 par often collapse, yielding places to trailers at rates exceeding 50%; take Cal Expo's budget meets, where data logs confirm outer-post closers with cool variants snag 32% shows when leaders overcook it.
Now, regional quirks add layers: Ontario's Woodbine Mohawk oval, with its long stretch, favors gate 7-9 stretch-runners if pace melts down, per provincial racing commission reports, while European trotting at Vincennes sees inside posts rule 70% of places due to mobile starts; trainers adapt by schooling "gate drills" weekly, boosting break scores by 15% on average. And in March 2026 previews for the Hambletonian Society stakes, early nominators eye pacers with dual-threat profiles—strong gates plus versatile pace—projecting them as each-way anchors amid rising purses.
Case Studies: Real Races, Real Edges
Consider the 2025 Messenger Stakes, where gate 1's Captaintreacherous colt dictated a 28.4 opener before rating to victory, but the post 5 stalker with perfect second-over pace paid $3.80 place; stats showed its profile matching 80% of prior winners, a blueprint for bettors. So too in a Pompano Park pace-off, outer gates faltered amid a suicide pace (27.1 first panel), handing triple-digit places to mid-pack horses whose metrics screamed value—gate 4 at even splits, gate 6 grinding rails.
These aren't outliers; aggregated over 10,000 starts, gate-pace combos forecast 62% of each-way payouts, per independent analyses from U.S. and Australian datasets. Yet closers from post 10 shine selectively, thriving only when leaders post sub-28 quarters, a niche that savvy players isolate for doubles.
Conclusion
Gate games and pace battles form the core of harness racing's predictive framework, where inside draws and controlled rhythms deliver consistent each-way returns; data underscores their reliability across tracks and distances, from USTA benchmarks to international parallels. As March 2026 circuits ramp up—think Meadowlands speed fests and Red Mile trotting wars—those stacking these metrics stand to gain, turning raw races into calculated plays. The writing's on the wall: ignore them at your peril, but harness them right, and the track's secrets unfold.