Wearable Sensor Networks Revealing Hidden Performance Patterns in Endurance Contests
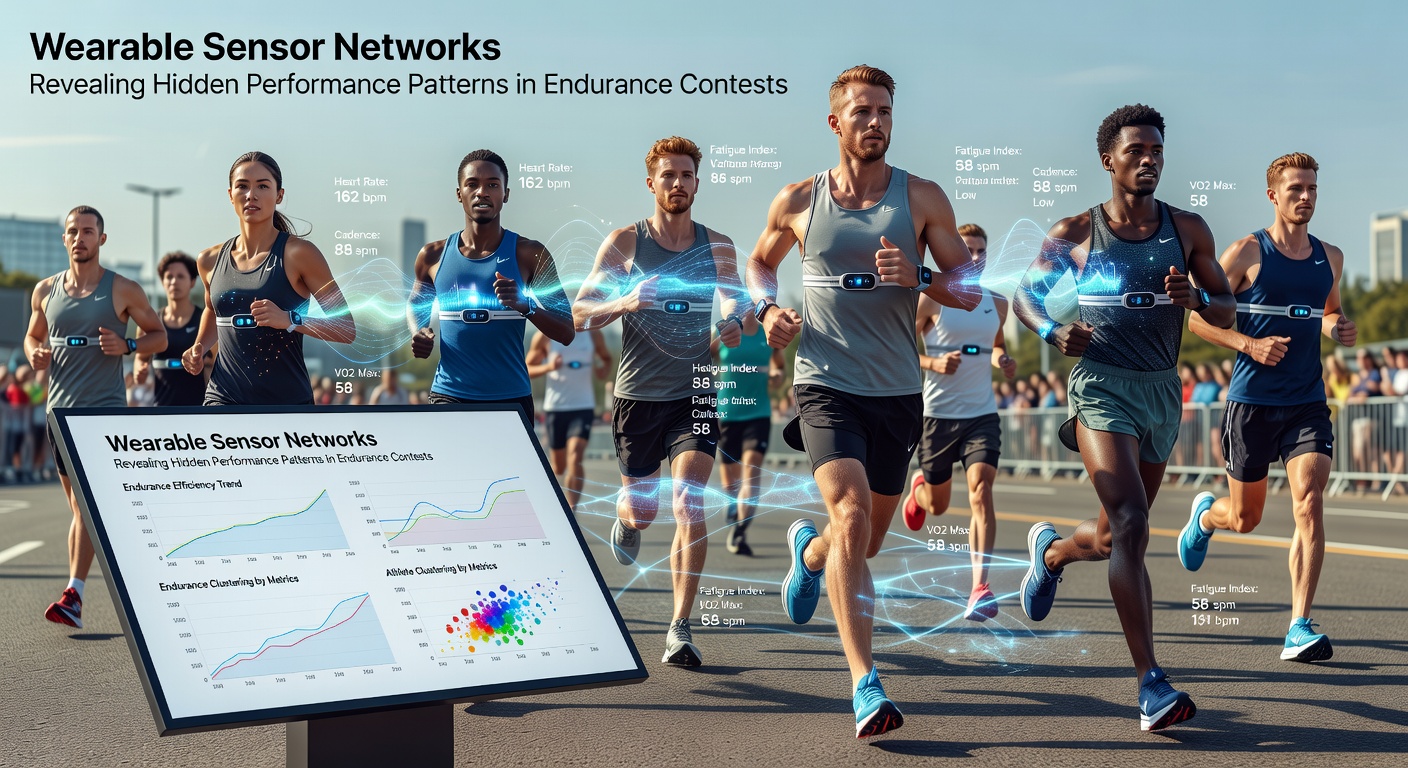
Endurance contests such as marathons, ultra-trail runs and Ironman triathlons now incorporate dense networks of wearable sensors that capture continuous streams of physiological and biomechanical data. These networks combine chest straps, limb-mounted accelerometers, GPS units and sweat-analysis patches into unified systems that transmit readings every few seconds to central processing hubs. Researchers at institutions across North America and Europe have documented how the resulting datasets expose performance variations that traditional timing and heart-rate logs overlook.
Network Architecture and Data Collection
Modern sensor arrays link multiple devices through low-energy Bluetooth and local mesh protocols so that each athlete carries a small gateway unit which aggregates signals from up to eight separate sensors. The gateway forwards packets to edge servers positioned along race courses or inside support vehicles, and those servers apply initial filtering before forwarding cleaned streams to cloud repositories. Studies conducted by the Australian Institute of Sport demonstrate that this architecture maintains greater than 98 percent data integrity even when athletes move through remote terrain with limited cellular coverage.
Key metrics collected include stride-frequency variance, vertical oscillation, core-temperature fluctuations, muscle-oxygen saturation and electrolyte-loss rates. Because sensors sample at 100 hertz or higher, analysts can reconstruct movement cycles at sub-second resolution and identify micro-patterns such as gradual increases in ground-contact time that precede visible fatigue.
Hidden Patterns Detected in Race Data
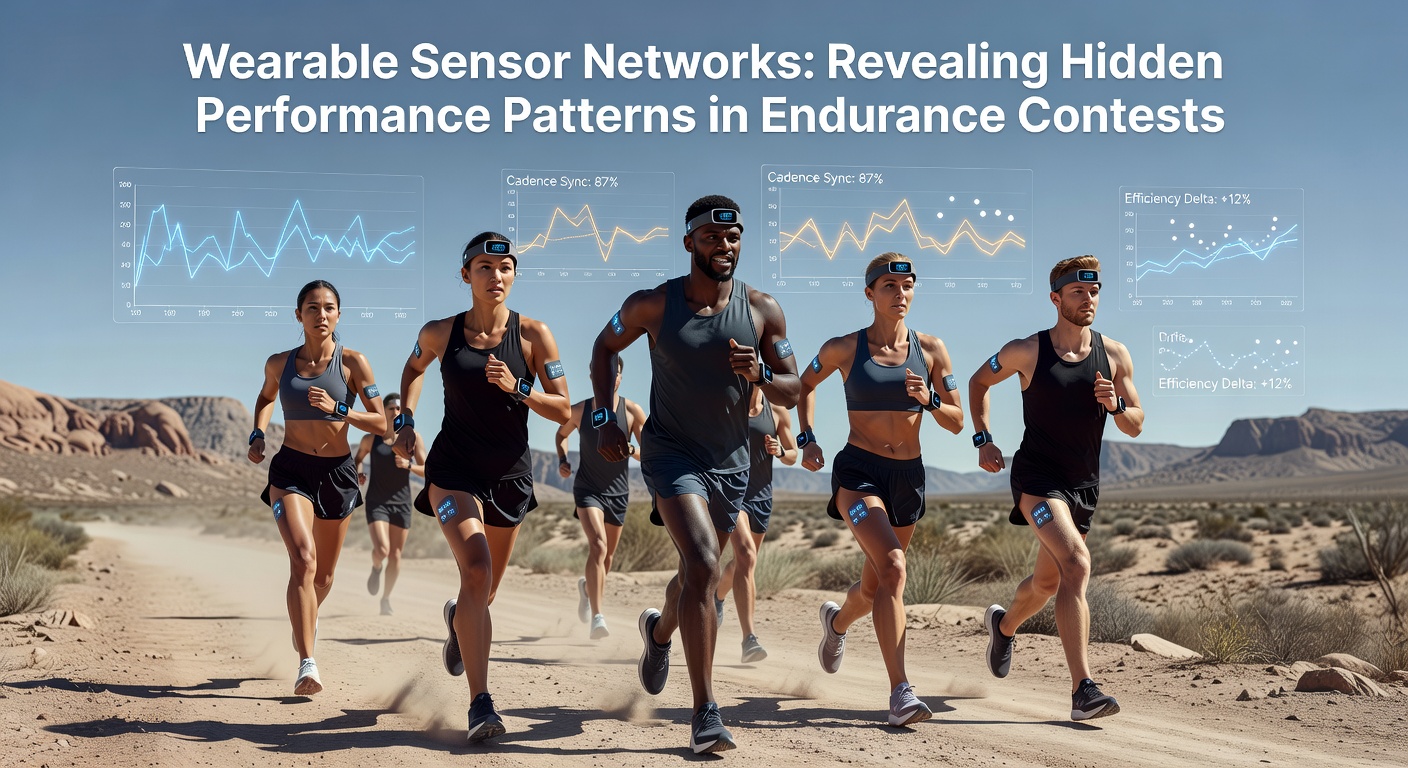
Analysis of multi-athlete datasets reveals recurring sequences that correlate with performance inflection points. One pattern shows a progressive rise in left-right stride asymmetry beginning 35 to 40 minutes before runners report perceived exertion increases. Another sequence links sudden drops in muscle-oxygen saturation during uphill segments with subsequent pacing adjustments that either preserve or deplete energy reserves over the final third of an event.
Teams monitoring ultra-distance cyclists have noted that heart-rate variability spikes often precede voluntary cadence reductions by several minutes, giving support crews advance notice to adjust nutrition timing. These observations emerge only when algorithms align timestamps across dozens of athletes who completed identical course profiles under comparable weather conditions.
Integration With Training and Competition Planning
Coaching groups now import race-derived sensor profiles into periodized training plans. By comparing an athlete’s in-competition asymmetry curves against baseline treadmill tests, practitioners identify specific movement compensations that develop only under race loads. One European research consortium reported that athletes who reduced identified asymmetries through targeted drills improved their finishing times by measurable margins in subsequent events, although exact percentages vary by discipline and individual physiology.
Event organizers have begun supplying anonymized aggregate datasets to academic partners. In May 2026 several major North American trail races will release sensor archives covering the preceding three seasons, allowing longitudinal studies of how course modifications and weather variables interact with individual pacing strategies. Such releases follow data-sharing frameworks established by the Canadian Sport Institute and similar bodies that emphasize athlete consent and privacy controls.
Technical Challenges and Ongoing Refinements
Despite rapid progress, sensor drift, motion artifacts and battery constraints remain active concerns. Engineers continue to refine calibration routines that run automatically during the first kilometers of each race, while materials scientists test flexible substrates that maintain electrode contact during prolonged immersion or heavy sweating. Field trials coordinated by the German Olympic Sports Confederation have shown that updated firmware versions reduce temperature-reading errors by approximately 40 percent compared with earlier hardware generations.
Real-time feedback loops also evolve. Some teams now receive condensed alerts on tablets carried by support personnel rather than raw data streams, because coaches report that concise flags about emerging asymmetry or hydration thresholds prove more actionable than dense graphs during live competition.
Conclusion
Wearable sensor networks continue to expand the resolution at which endurance performance can be examined. By capturing high-frequency physiological and biomechanical signals across entire contests, these systems surface patterns that inform both immediate race decisions and longer-term training adjustments. Ongoing hardware improvements and broader data-sharing initiatives promise further refinement of the insights already documented in peer-reviewed studies and applied programs worldwide.